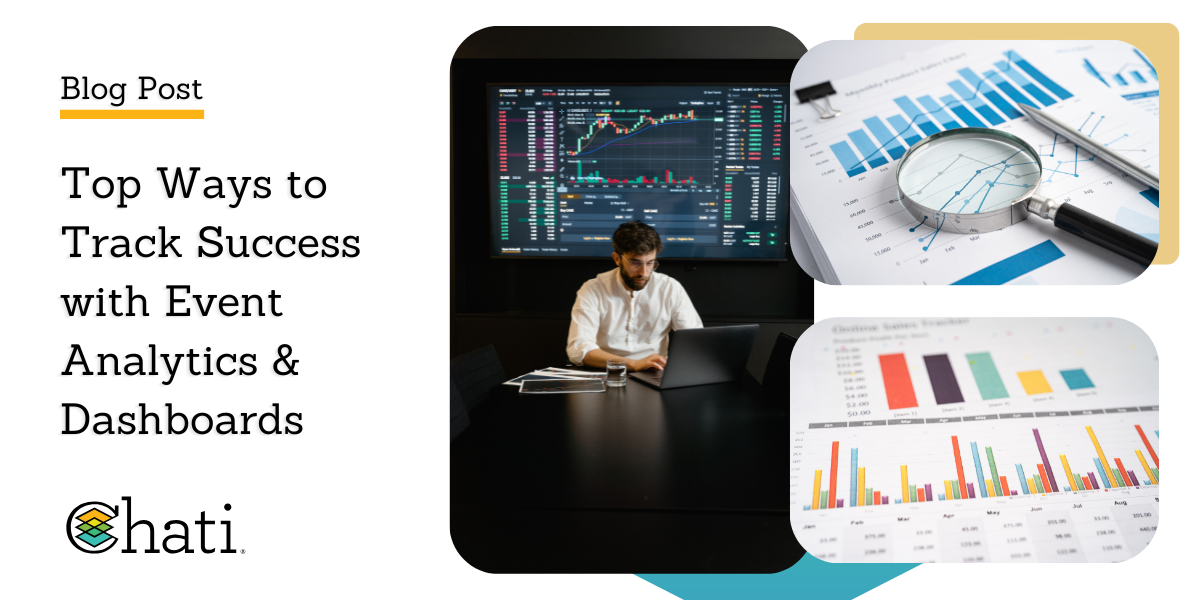
In recent years, there has been a significant shift toward data-driven event strategies, as organizers increasingly rely on measurable insights to plan, execute, and evaluate their events. Tracking performance in real time and conducting thorough post-event analysis have become essential practices for identifying what works, optimizing engagement, and making informed decisions.
Here, we will discuss how virtual and hybrid events can be successful through event analytics & dashboards, including what they are, real-time optimization, return on investment (ROI), and more. With this, you will have the tools and resources to organize a successful virtual or hybrid event, while also obtaining pertinent data and information.
What Are Event Dashboards and Why Do They Matter?
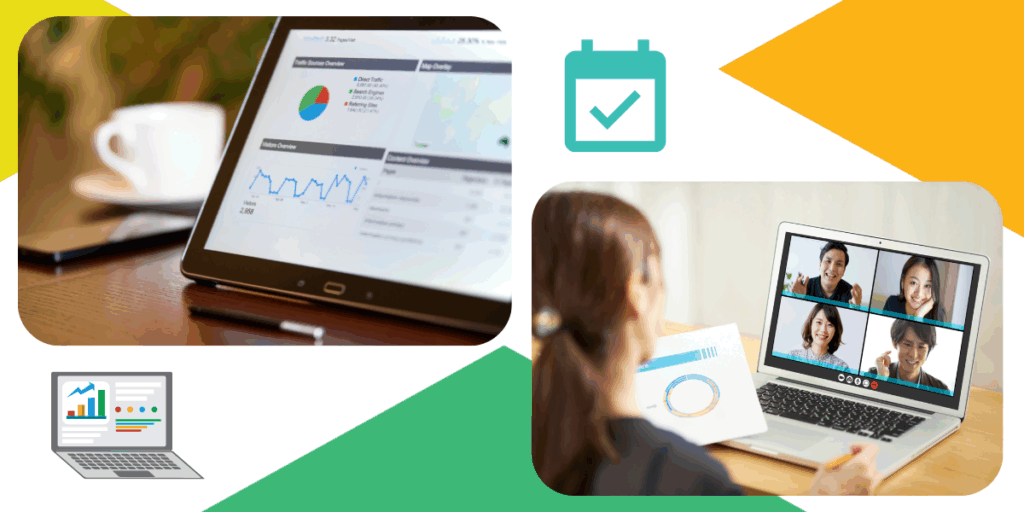
Event dashboards are centralized digital platforms that collect, visualize, and track key metrics throughout the event lifecycle, offering real-time insights into everything from registration and attendee engagement to post-event ROI. By consolidating data into a single, easy-to-navigate interface, these dashboards empower organizers to monitor performance instantly, make on-the-fly adjustments, and align event outcomes with strategic goals. This comprehensive visibility enables teams to see the full picture, connecting each phase of the event journey to measurable impact and value.
Top Metrics to Track with Event Analytics Tools

1. Registration and Attendance Trends
Analyzing the difference between total registrants and actual attendance is crucial for understanding audience behavior and refining event strategies. By identifying drop-off points and tracking session attendance patterns, organizers can pinpoint when and where attendees lose interest or disengage. These insights help improve future programming, optimize scheduling, and tailor content to keep participants engaged throughout the event.
2. Engagement Metrics
Measuring interactive elements such as poll participation, Q&A activity, and chat volume offers valuable insight into attendee engagement and the overall effectiveness of event content. Coupled with data on average session duration and the most and least attended sessions, organizers can gauge which topics and formats resonate most with their audience. These metrics help refine future programming and enhance the attendee experience by focusing on what drives the highest levels of interaction and sustained interest.
3. Content Performance
Tracking views, downloads, and replays of sessions or materials provides valuable post-event insight into what content continues to engage attendees beyond the live experience. This data helps identify top-performing speakers, popular topics, and the most effective presentation formats, allowing organizers to replicate successful elements in future events. Understanding these patterns ensures content remains relevant, impactful, and aligned with audience interests.
4. Networking & Interaction Insights
Metrics like the number of 1:1 meetings, messages sent, and group chat engagement offer a clear view of how effectively an event fosters meaningful connections among participants. For platforms that include AI-powered matchmaking, tracking the success of these connections—such as accepted meeting requests or follow-up interactions—provides additional insight into the quality of networking opportunities. Together, these engagement indicators help organizers assess the strength of community-building efforts and enhance the networking experience in future events.
5. Sponsor & Exhibitor ROI Metrics
Booth visits, resource downloads, and CTA clicks are key indicators of attendee interest and sponsor visibility during an event. When combined with metrics like lead generation, dwell time, and interactive engagements, organizers and exhibitors can gain a deeper understanding of which booths or offerings captured the most attention. These insights are essential for evaluating exhibitor ROI, optimizing booth strategies, and enhancing future sponsorship opportunities.
Best Platforms & Tools for Event Analytics
Leading analytics-enabled event platforms such as Chati, Webex Events, ON24, Hopin, and Cvent offer robust tools to help organizers track and optimize event performance. These platforms provide a range of features designed to turn raw data into actionable insights, including customizable dashboards, real-time updates, and exportable reports. When choosing a platform, it's important to look for those that offer flexibility in data visualization, seamless integration with other tools, and the ability to generate clear, shareable summaries that demonstrate value to stakeholders.
Using Dashboards for Real-Time Optimization

Real-time analytics empower event organizers to make dynamic adjustments during the event, such as promoting under-attended sessions based on live attendance data. This agility also allows teams to enhance networking features or address other underperforming areas on the spot, improving the overall attendee experience. By quickly identifying content gaps and bottlenecks in attendee flow, organizers can fine-tune event execution in real time, ensuring higher engagement and smoother navigation throughout the event.
Post-Event Analysis for Long-Term Improvement

Event data plays a crucial role in creating comprehensive wrap-up reports that showcase performance to sponsors and inform internal teams. These reports highlight key metrics and engagement trends, offering valuable insights that can be applied to future event planning, such as refining agenda design, enhancing marketing strategies, and prioritizing high-performing content. Over time, collecting and comparing this data helps build historical benchmarks, enabling organizers to track progress, set realistic goals, and continuously improve the impact and effectiveness of their events.
Turning Data into ROI

Dashboards are powerful tools for proving event value to stakeholders by translating complex data into clear, actionable insights. By connecting attendee engagement to tangible outcomes—such as conversions, lead generation, sales, or audience growth—dashboards demonstrate the real impact of an event. When paired with effective data storytelling, these insights help retain sponsors and justify budgets by illustrating success in a compelling narrative, making it easier for decision-makers to see the return on investment and support future initiatives.
Summary
Here, we discussed how virtual events and hybrid events can be successful through event analytics & dashboards, including what they are, real-time optimization, return on investment (ROI), and more. Going forward, you will be able to organize successful virtual and hybrid events while also successfully tracking event data.

We encourage event planners to adopt tools that go beyond vanity metrics, and please contact Chati if you are interested in learning more about how we incorporate analytics into our virtual and hybrid events.
